The Pace Car: how it works
Every other board scores what a rep already did. The Pace Car scores what the number still demands. It takes each rep’s remaining gap to quota and runs the funnel backwards — into a required daily pace, in the activities they can actually do today. There’s no opponent: you race your own projected finish against the target line, so “behind” stops being a quarter-end surprise and becomes a Tuesday number.
01The board in one look
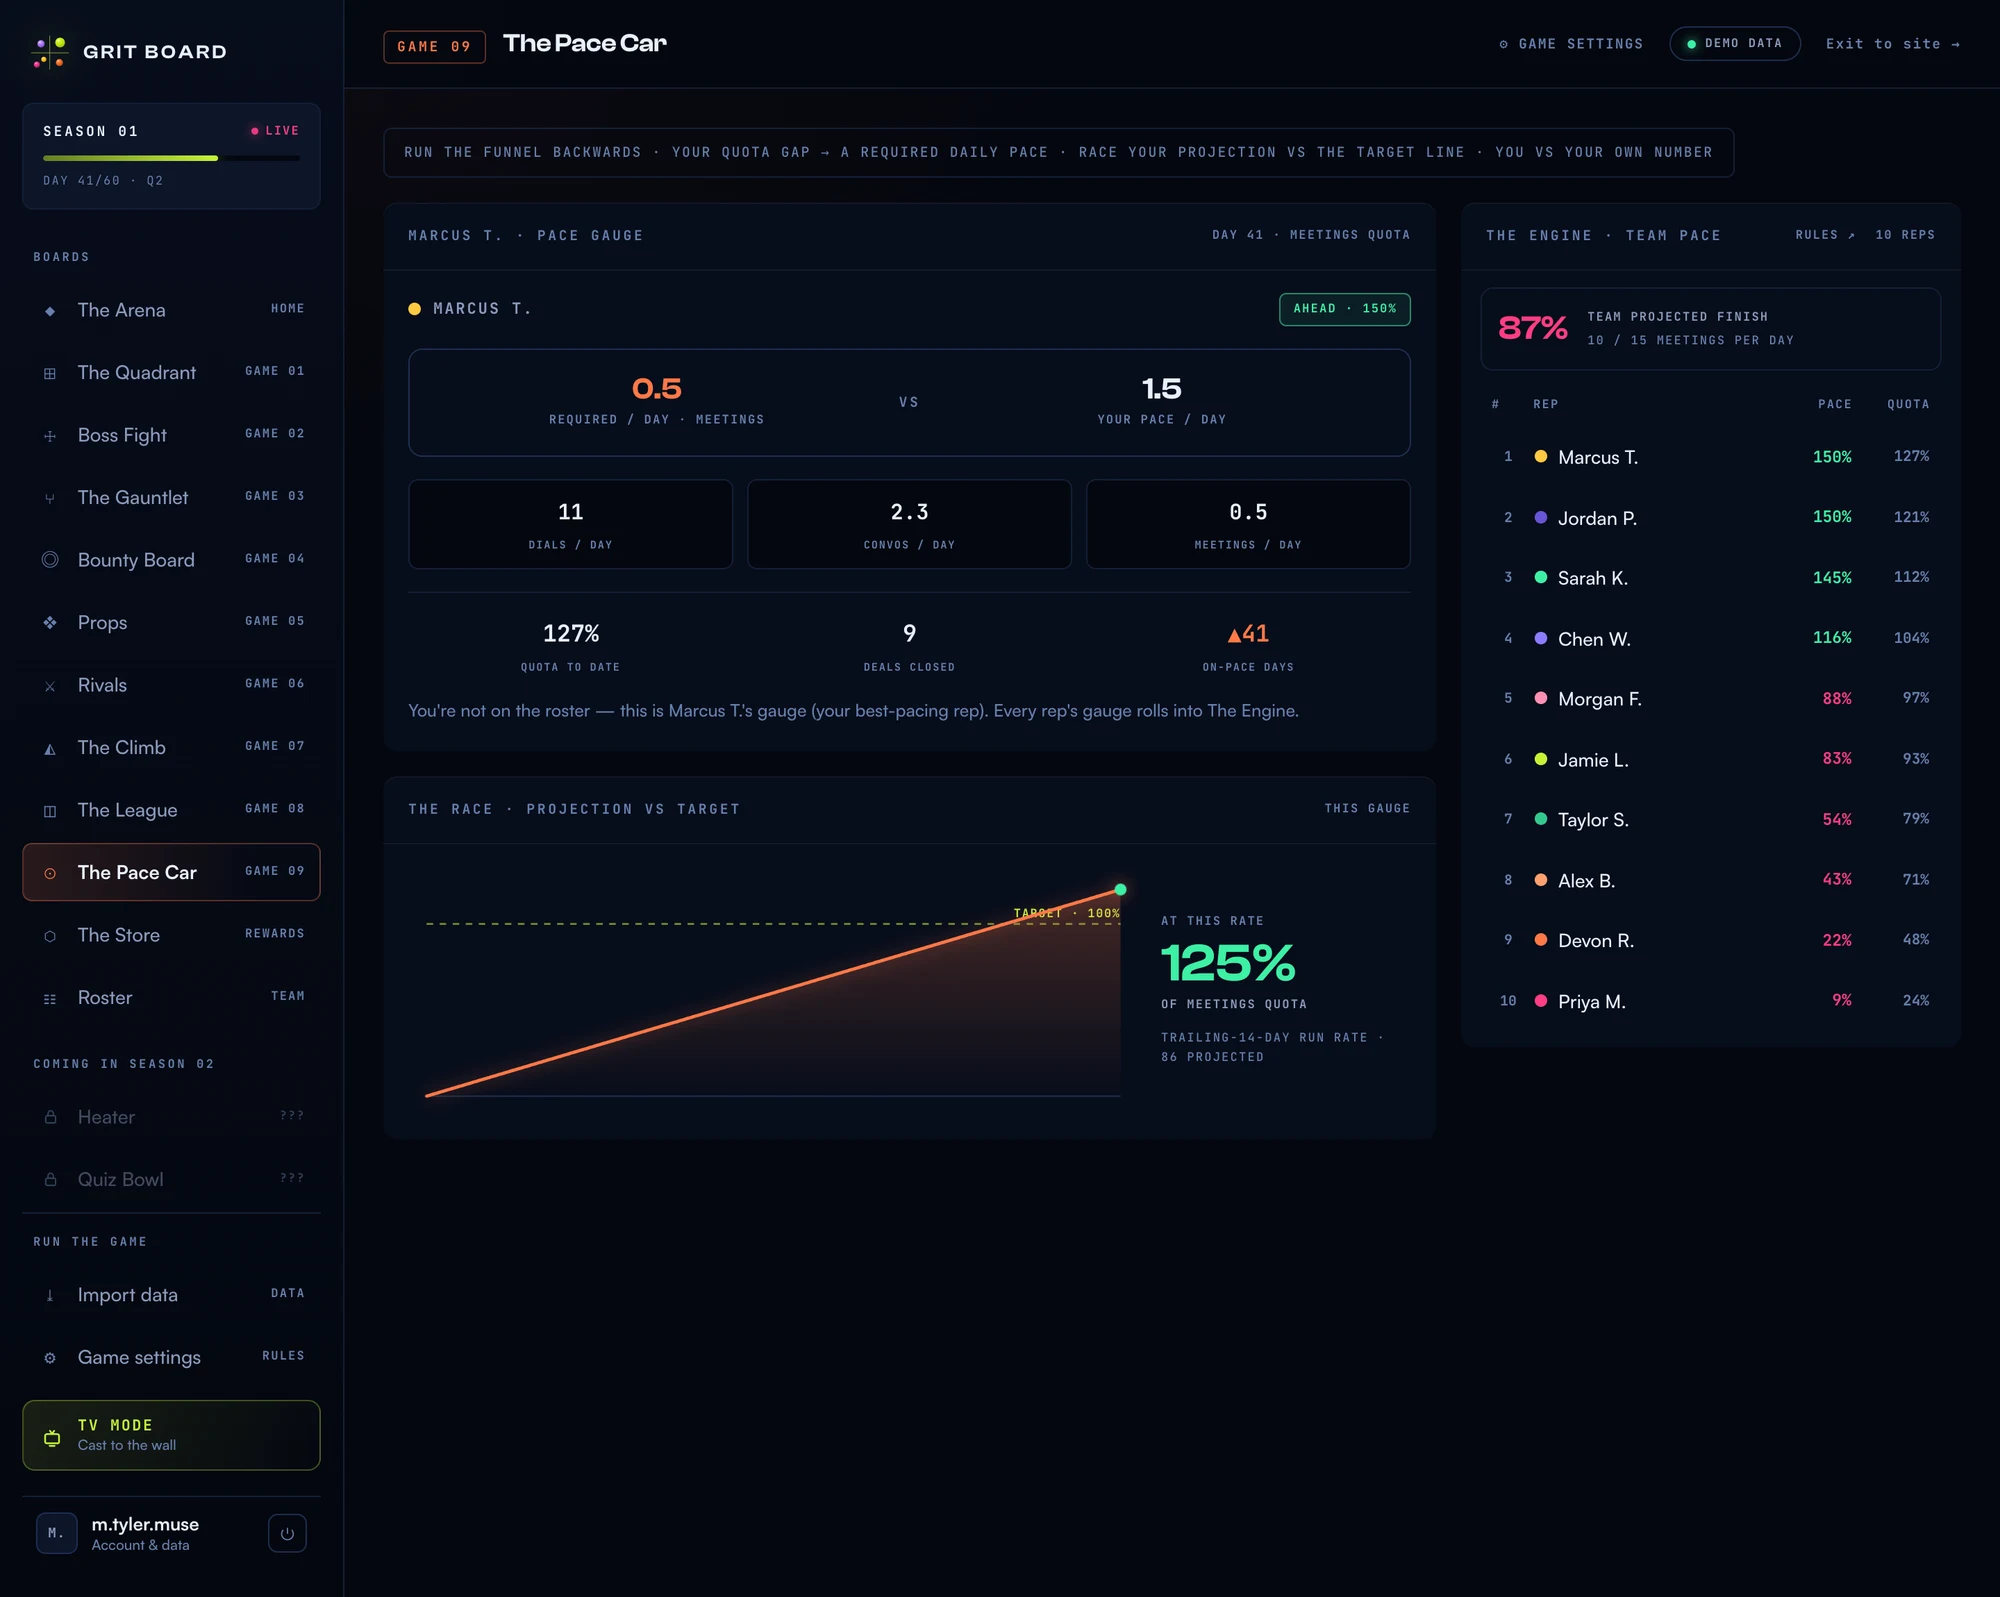
Top: the pace gauge — required versus actual, with the daily activity numbers. Middle: the race, your projected finish against the target line. Right: the Engine — the whole team’s pace at a glance.
02The gauge — your funnel, backwards
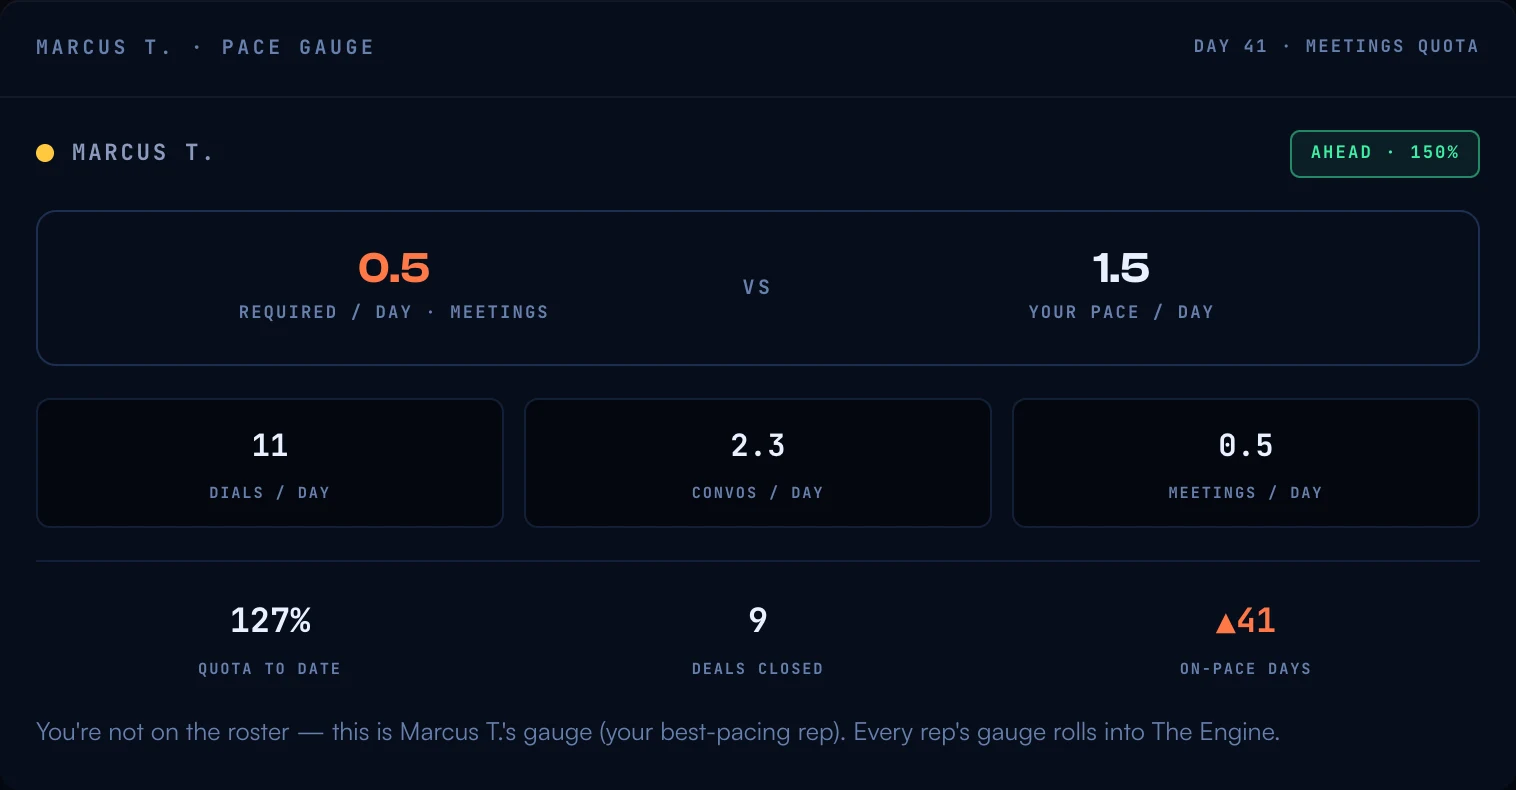
The math runs in three steps, all visible on the card:
- Your gap. Whatever’s left between your quota target and what you’ve banked so far.
- Your required daily pace. That gap spread over the days remaining — the number on the quota metric you’d need per day to land exactly on target.
- The activities that produce it. The requirement chains down the funnel using your team’s benchmark conversion rates: half a meeting a day becomes 2.3 convos a day becomes 11 dials a day. The gauge hands you tomorrow’s to-do list, not a scary total.
The band chip says where you stand against the pace the gap demands: AHEAD (105%+), ON PACE (90–105%), or BEHIND (under 90%).
The demo gauge above also shows on-pace days — consecutive days at or above the required daily points. Counting that honestly takes true day-by-day history, and Grit Board stores season totals, not day-by-day activity — so on your own gauge the counter simply doesn’t appear. No made-up streaks: everything the gauge does show is math on numbers you actually gave it.
03The race — projection vs target
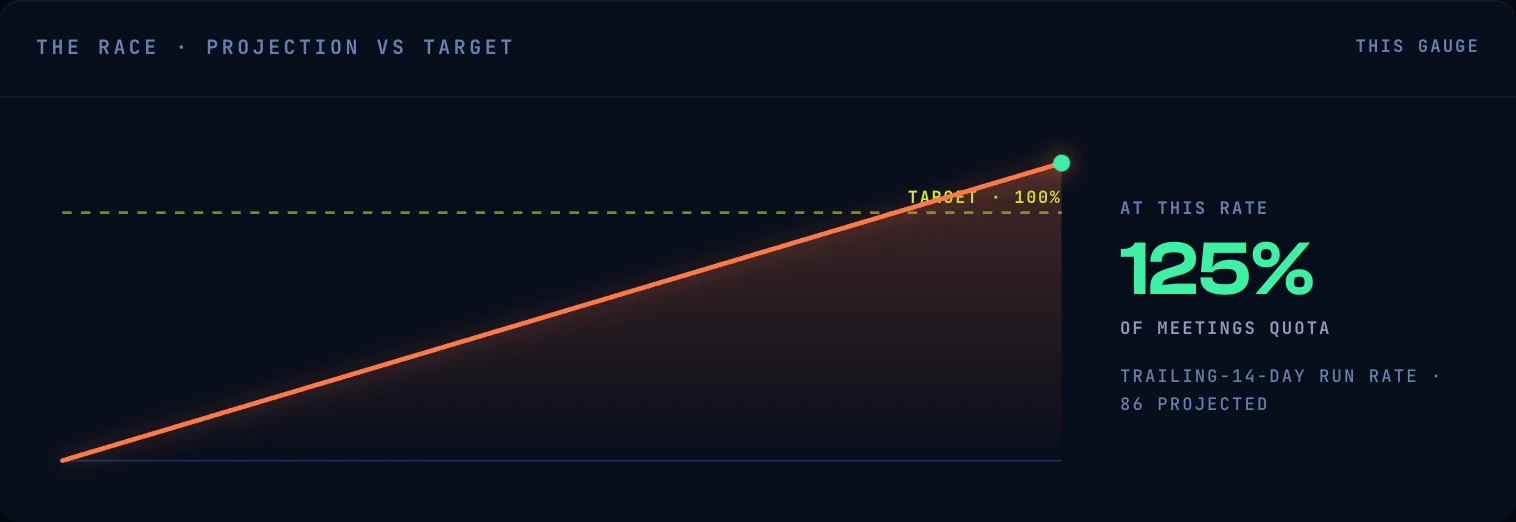
The race answers one question: at your current rate, where do you finish? Your run rate is your season-to-date pace — what you’ve banked, over the days you’ve played — projected to the final day and drawn against the target line, and the board names its basis right under the number (SEASON-TO-DATE RUN RATE). Crossing the dashed line early is the win state; a projection falling short tells you exactly how far off the current pace is — while there’s still time to change it. (The built-in demo, which carries day-by-day history, sharpens its rate to the trailing 14 days instead — that’s the label in the screenshot above.)
04The Engine — the team’s pace
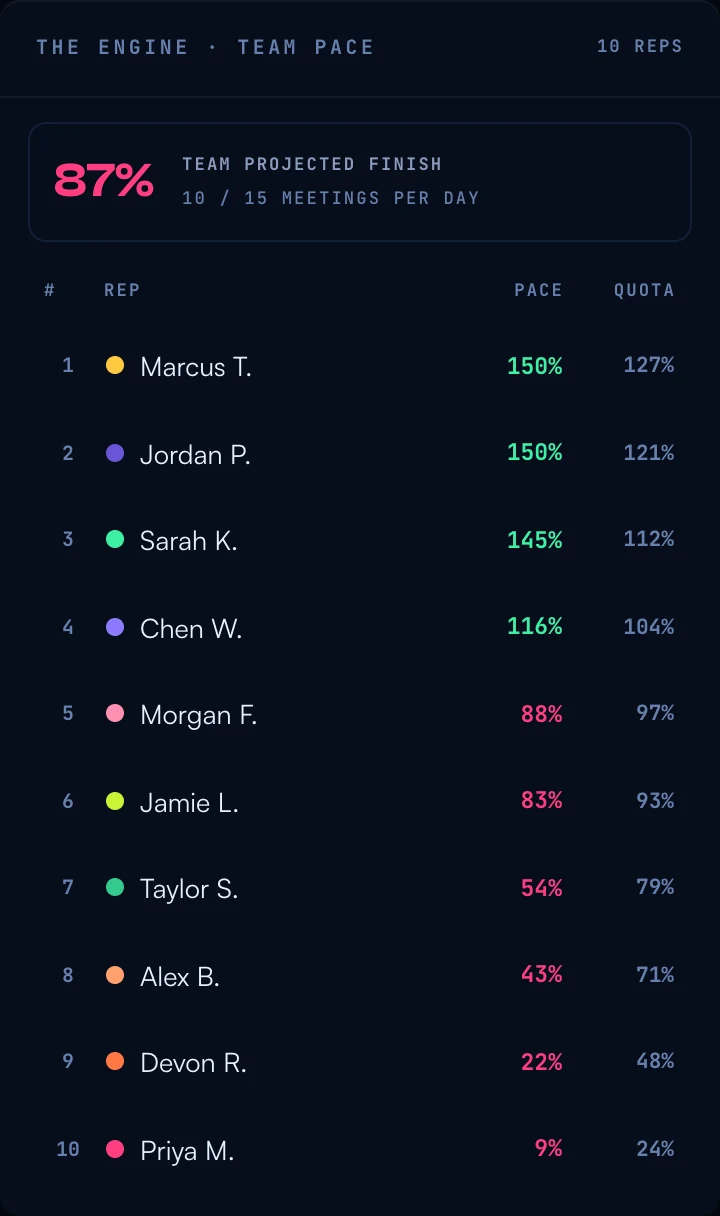
The Engine folds every rep’s pace into one team projected finish, then lists the roster with two columns: pace (against what their own gap demands) and quota (attainment to date). For a manager, pace is the early-warning column — a rep at decent attainment but 54% pace is running out of runway, and that shows here weeks before it shows in the forecast.
05Setting it up (managers)
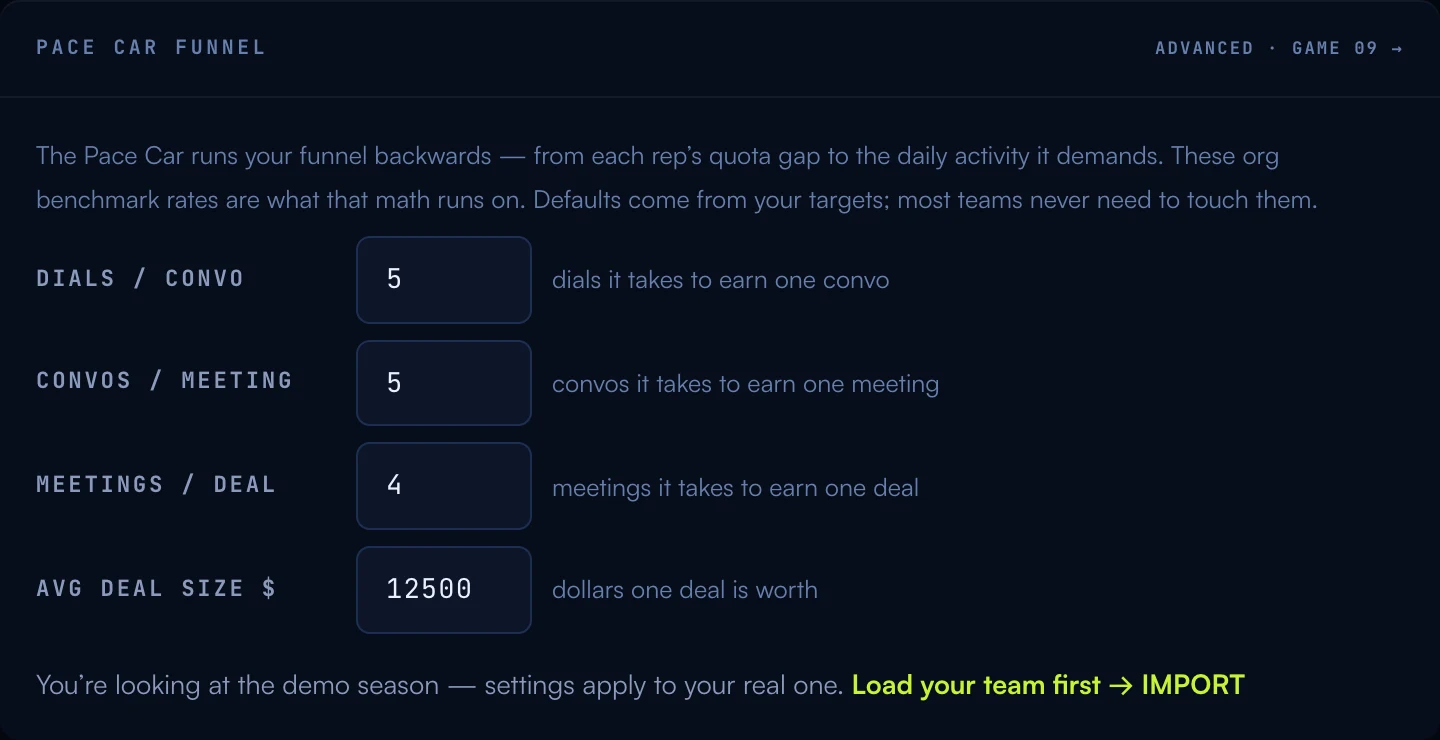
One card: your funnel’s benchmark conversion rates — how many dials earn a convo, convos a meeting, meetings a deal, and what an average deal is worth (that last one converts a dollar quota into a deal count). Defaults are derived from your targets, so most teams never touch this. The rates are deliberately manager-owned: the required-pace math is only trustworthy if reps can’t tune it.
06Common questions
“Why does my required number keep going up?” Because it’s recomputed from your remaining gap. Fall behind and the daily requirement ramps; get ahead and it shrinks — hit your full quota and it drops to zero. The ramp is the game: it makes the cost of a slow week visible while it’s still recoverable.
“Is my gauge public?” Your detailed gauge is your own view, but the Engine shows everyone’s pace and quota percentages to the whole team — same everyone-sees-the-board honesty as the rest of Grit Board.
“How fast does the projection move?” It re-draws on every upload or sync: new activity raises both what you’ve banked and your run rate, and the projected finish follows. It’s deliberately steady — a season-to-date rate can’t whipsaw on one odd day — so when the line moves, your pace really changed.
More questions? Write to hello@gritboard.io — a human reads it. Curious what the game feels like? See the Pace Car overview.