The Quadrant: how it works
The Quadrant is Grit Board’s first game. Every rep on your team is a dot on one board: the further right, the more of the expected activity they’re doing; the higher up, the closer they are to quota. One glance answers the two questions every sales manager asks — who’s working and who’s winning — and, more usefully, who’s doing one without the other.
01The board in one look
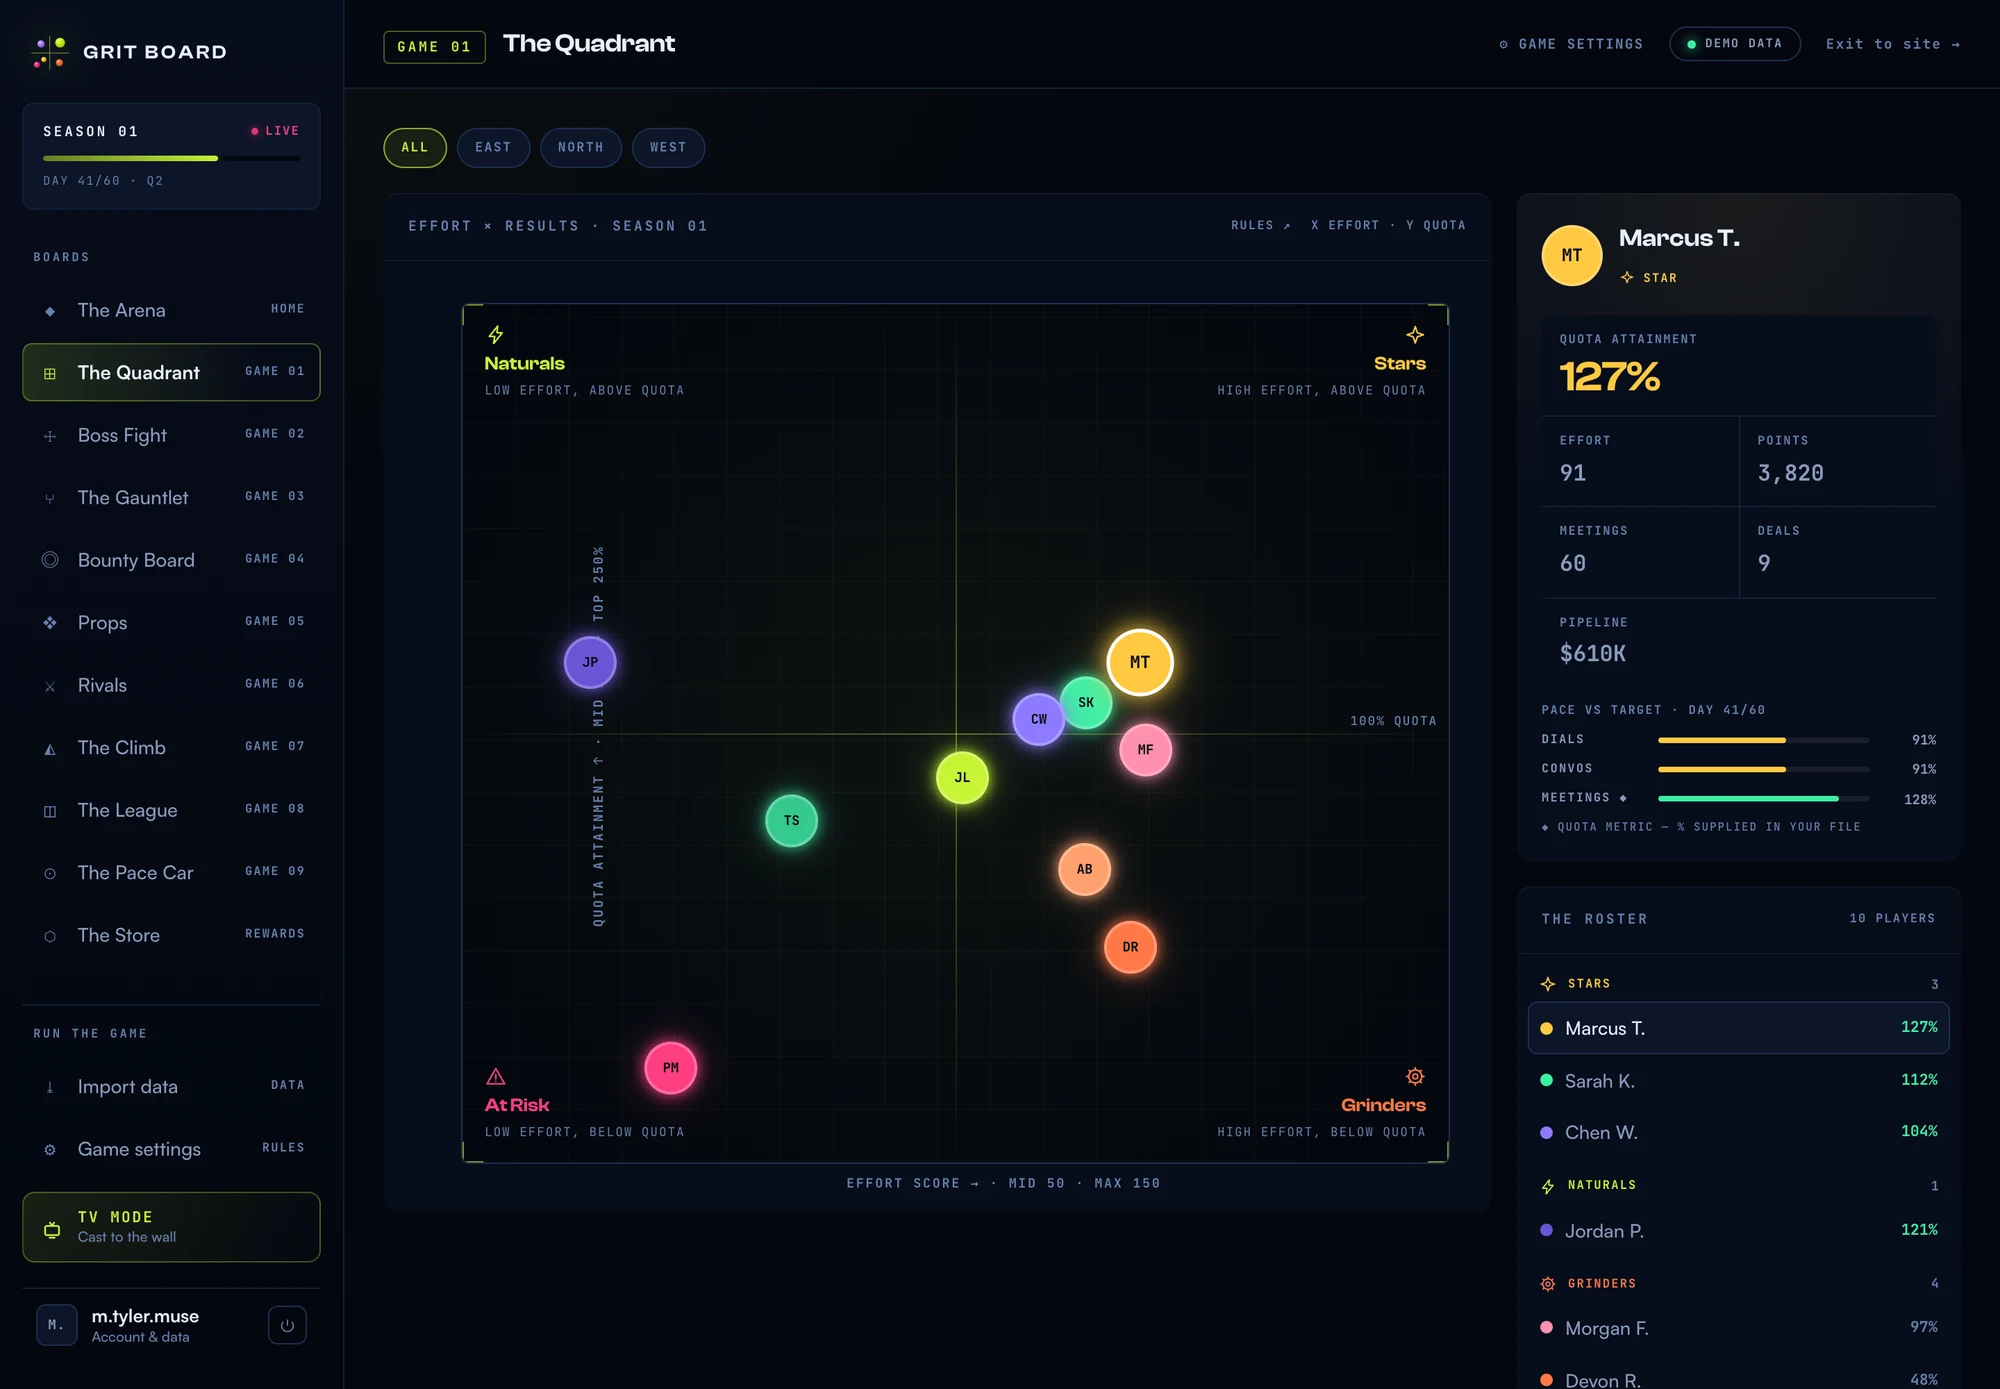
Left side: the plot. Right side: the roster grouped by zone, and a card for whichever player you’ve selected. Hover or tap any dot to see exactly why it sits where it sits — nothing on this board is a black box.
02The four zones
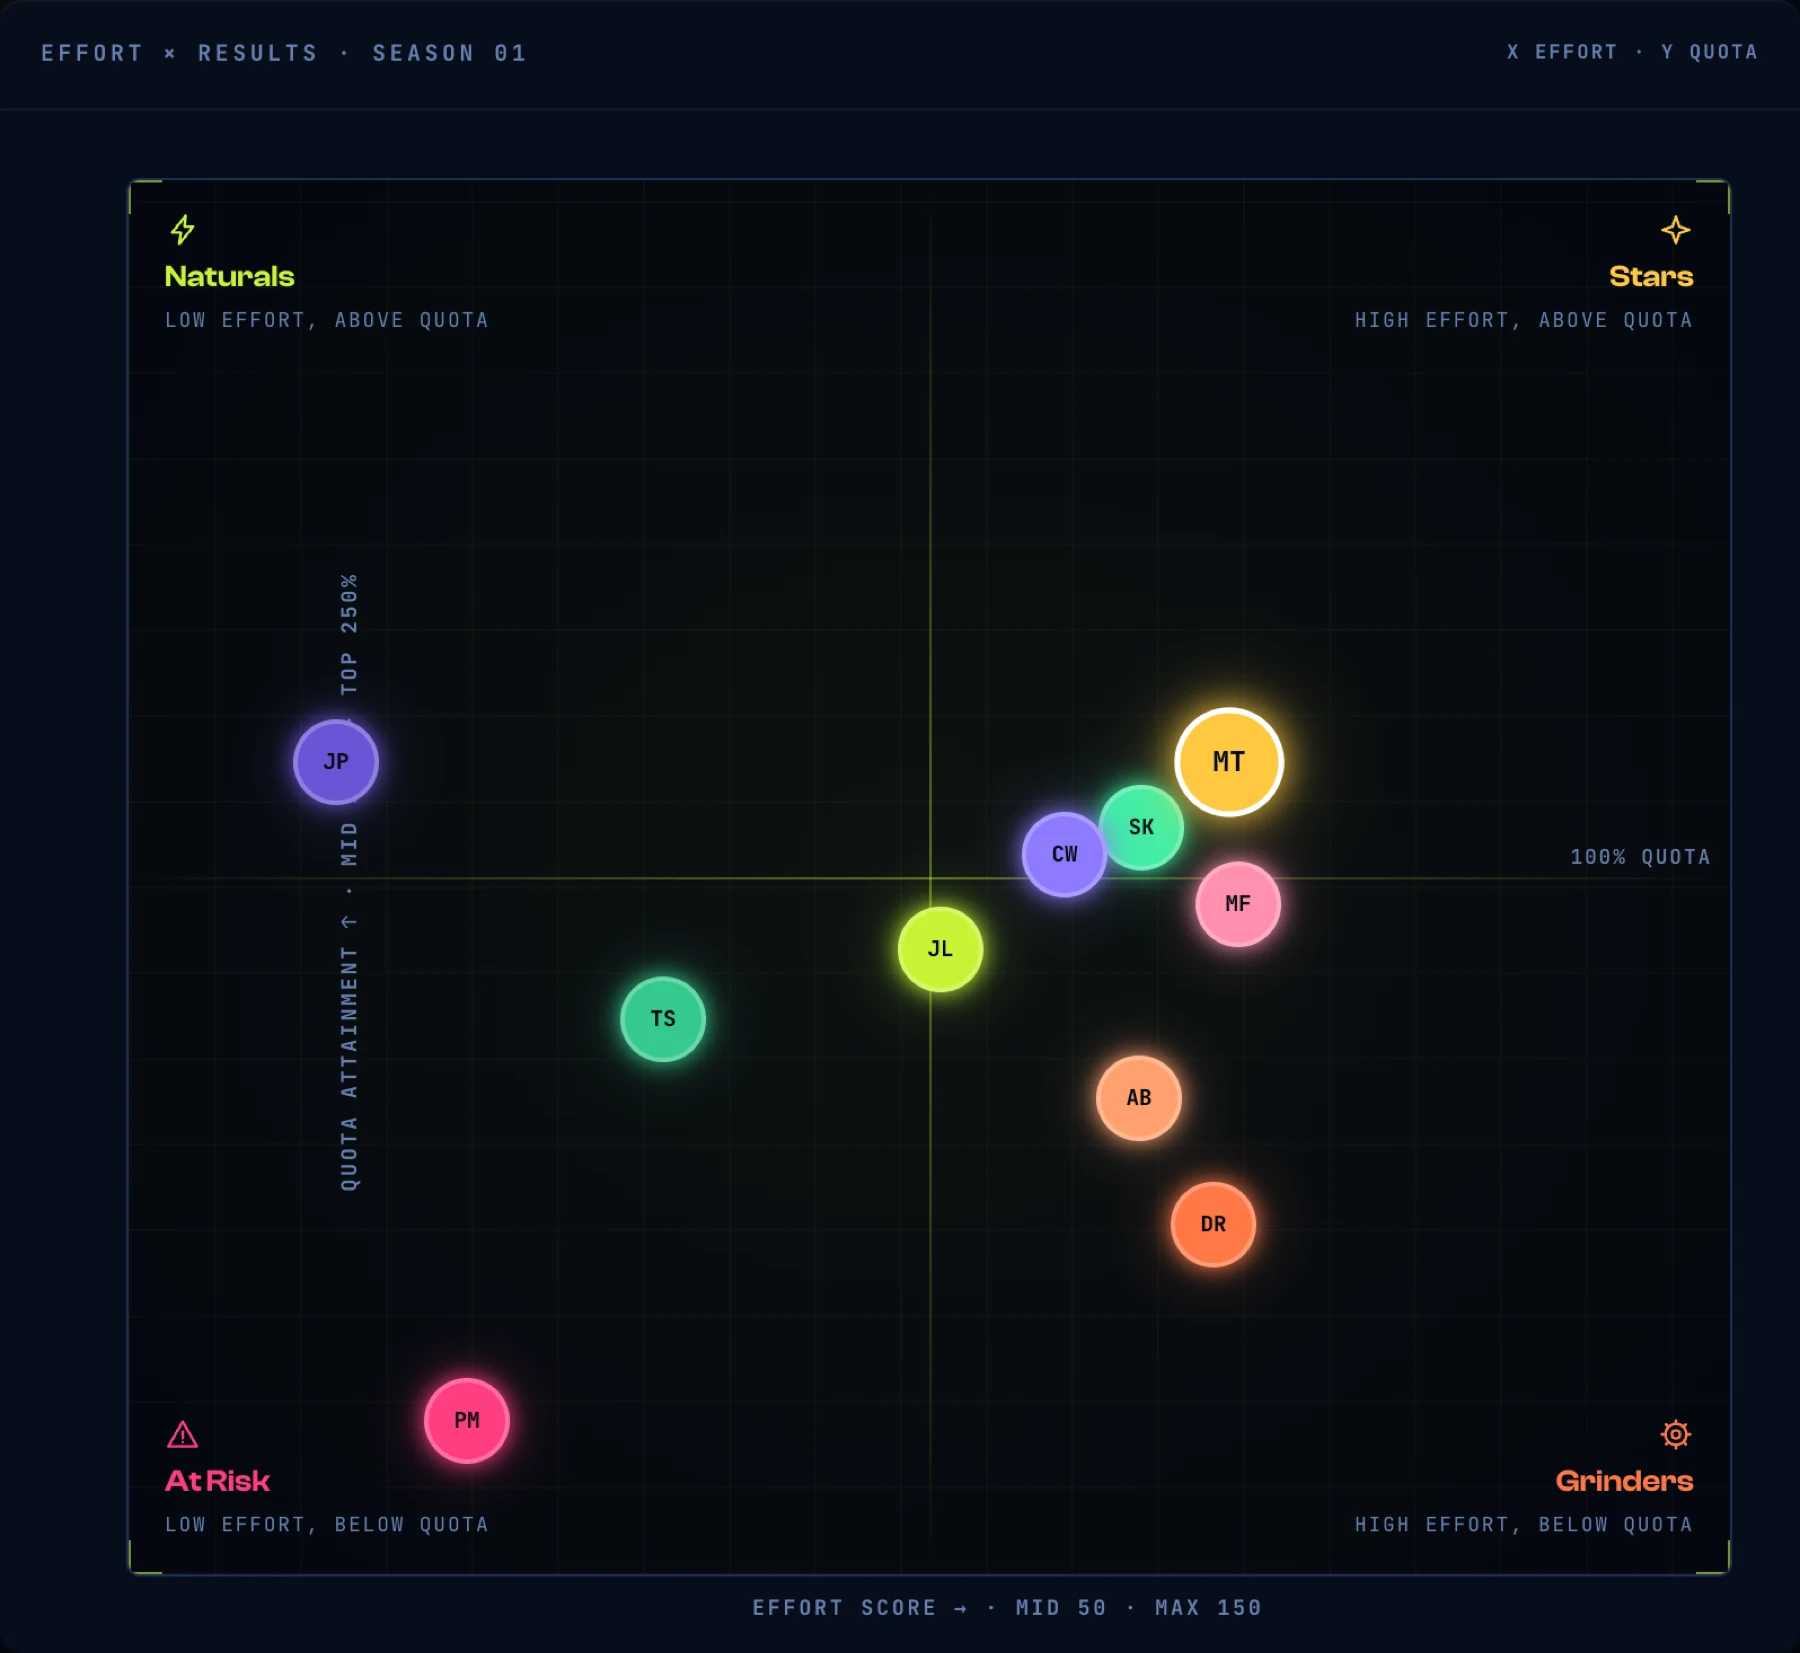
- Stars High effort, above quota. (top right) — Doing the work and hitting the number. This is the corner everyone is trying to reach.
- Naturals Low effort, above quota. (top left) — Hitting the number without much activity. Worth a conversation — they may have a shortcut the whole team should learn, or a big deal masking a quiet pipeline.
- Grinders High effort, below quota. (bottom right) — The work is happening but the results aren’t landing yet. Effort isn’t the problem — coach the technique, not the hustle.
- At Risk Low effort, below quota. (bottom left) — Behind on the number and doing less than half the expected activity. This corner is a flag to step in early, not a punishment.
The lines that split the board: the horizontal line is 100% of quota, and the vertical line is an effort score of 50 — half the expected activity pace. The low-effort half is deliberately forgiving: a rep only reads as “low effort” when they’re doing less than half of what the team’s targets expect, so landing there is a real signal, not noise.
03The two scores, in plain words
Quota attainment (up/down). Your team picks one metric as “the number” — meetings booked for an SDR team, revenue for closers. The score is simply what a rep has delivered so far this season versus where the target says they should be by today. 100% means on target. It’s uncapped, because 240% of quota is a real story worth telling.
Effort score (left/right). Effort measures the inputs — the activity metrics your manager tracks. Each metric is compared to its expected pace for this point in the season, then blended by an Effort % your manager sets per metric (they must sum to 100 across whatever’s live). 100 means on pace on everything, weighted the way your manager said it should count; 50 means half pace overall; 150 is the cap, so one huge metric can’t carry the score alone. See how scoring works for the full composition rules.
Three rules keep the effort score fair:
- Outputs never count as effort. Deals and pipeline are results, not activity — they live on the quota axis and the leaderboard, never in the effort score.
- The quota metric is excluded too. If quota is meetings, meetings don’t also count as effort. Each axis measures a different thing, so a rep can honestly be a Natural — above quota on low activity.
- Nobody is graded on a curve. Your effort score is you versus the targets, never you versus teammates. A monster week from the rep next to you cannot move your dot.
If every activity metric ends up benched, unpaced, or serving as the quota, there’s nothing left to build a score from — the board shows an EFFORT PAUSED state instead of quietly reading the whole team as 0. Quota and points keep working; only the horizontal axis goes quiet until a metric has both a pace and a percentage assigned to it.
04Click any dot: the “why” card
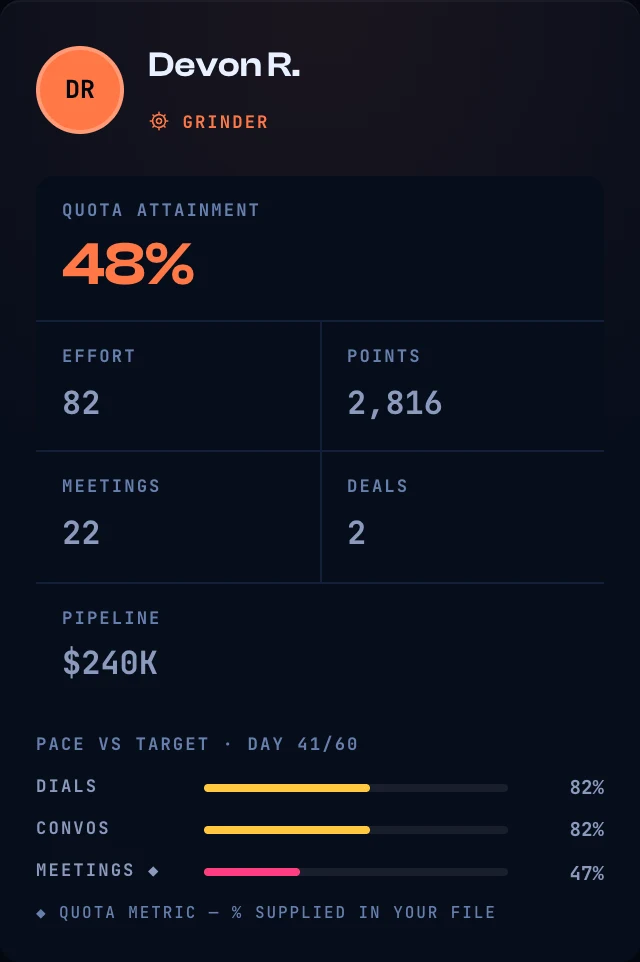
Selecting a player shows the receipts: each metric’s pace versus its prorated target as of today (DAY 41/60 means targets are scaled to 41 days, not the full season — nobody is behind just because the season isn’t over). The ◆ marks the quota metric. When a rep asks “why does the board say 62?”, this card is the answer — and the same math a manager can walk through in a 1:1.
05Setting it up (managers)
Everything lives in Game settings, two cards, in order:
- Season setup. Pick your team type (SDR, AE, full-cycle, field, canvassing — it presets sensible names and weights) and your season window (month, quarter, or custom) with its real start date.
- Metrics. One row per metric, and everything about that metric on it: its name in your team’s words (“Dials” can be “Doors” or “Demos”), the weekly pace, an Effort % (how much of the effort score this metric carries — every live row’s percentage must sum to 100), the points it earns, and its role chips. QUOTA is the chip you move — tap it onto whichever metric is each rep’s number and set that row’s pace; a quota row is excluded from effort automatically. Bench a row with ✕ and it stops everything at once: no points, no pace, no effort, no Grit Coin. A PRICE FROM PACES button fills the points column from your paces alone (a balanced week pays balanced points); if you’d rather think in shares of a week, Balance points from importance does the same one-shot pricing from a share you set instead. See how scoring works for the full detail on both.
The season start date matters more than it looks: effort and quota measure pace over the days since the start, so a wrong date reads the whole team too hot or too cold.
06Common questions
“I’m above quota — why is my dot on the left?” Because the axes measure different things on purpose. Left-side-but-above-quota is the Naturals zone: the number is landing on below-target activity. That’s information, not an accusation.
“What counts as effort?” Only the activity metrics your manager set targets for — never deals, never pipeline, never the quota metric itself. The player card lists exactly which metrics feed your score.
“When does the board update?” Whenever new data lands: a CSV import updates it immediately, and a connected CRM syncs on a schedule plus a manual “sync now.”
More questions? Write to hello@gritboard.io — a human reads it. Curious what the game feels like? See The Quadrant overview for the live demo.