The Arena: reading the home board
The Arena is the screen Grit Board opens on — not a game, but the command center over all of them. One glance answers three questions: how is the team doing, who’s winning, and what’s my fight? Everything on it is a lens on the same season dataset the nine games run on.
01The board in one look
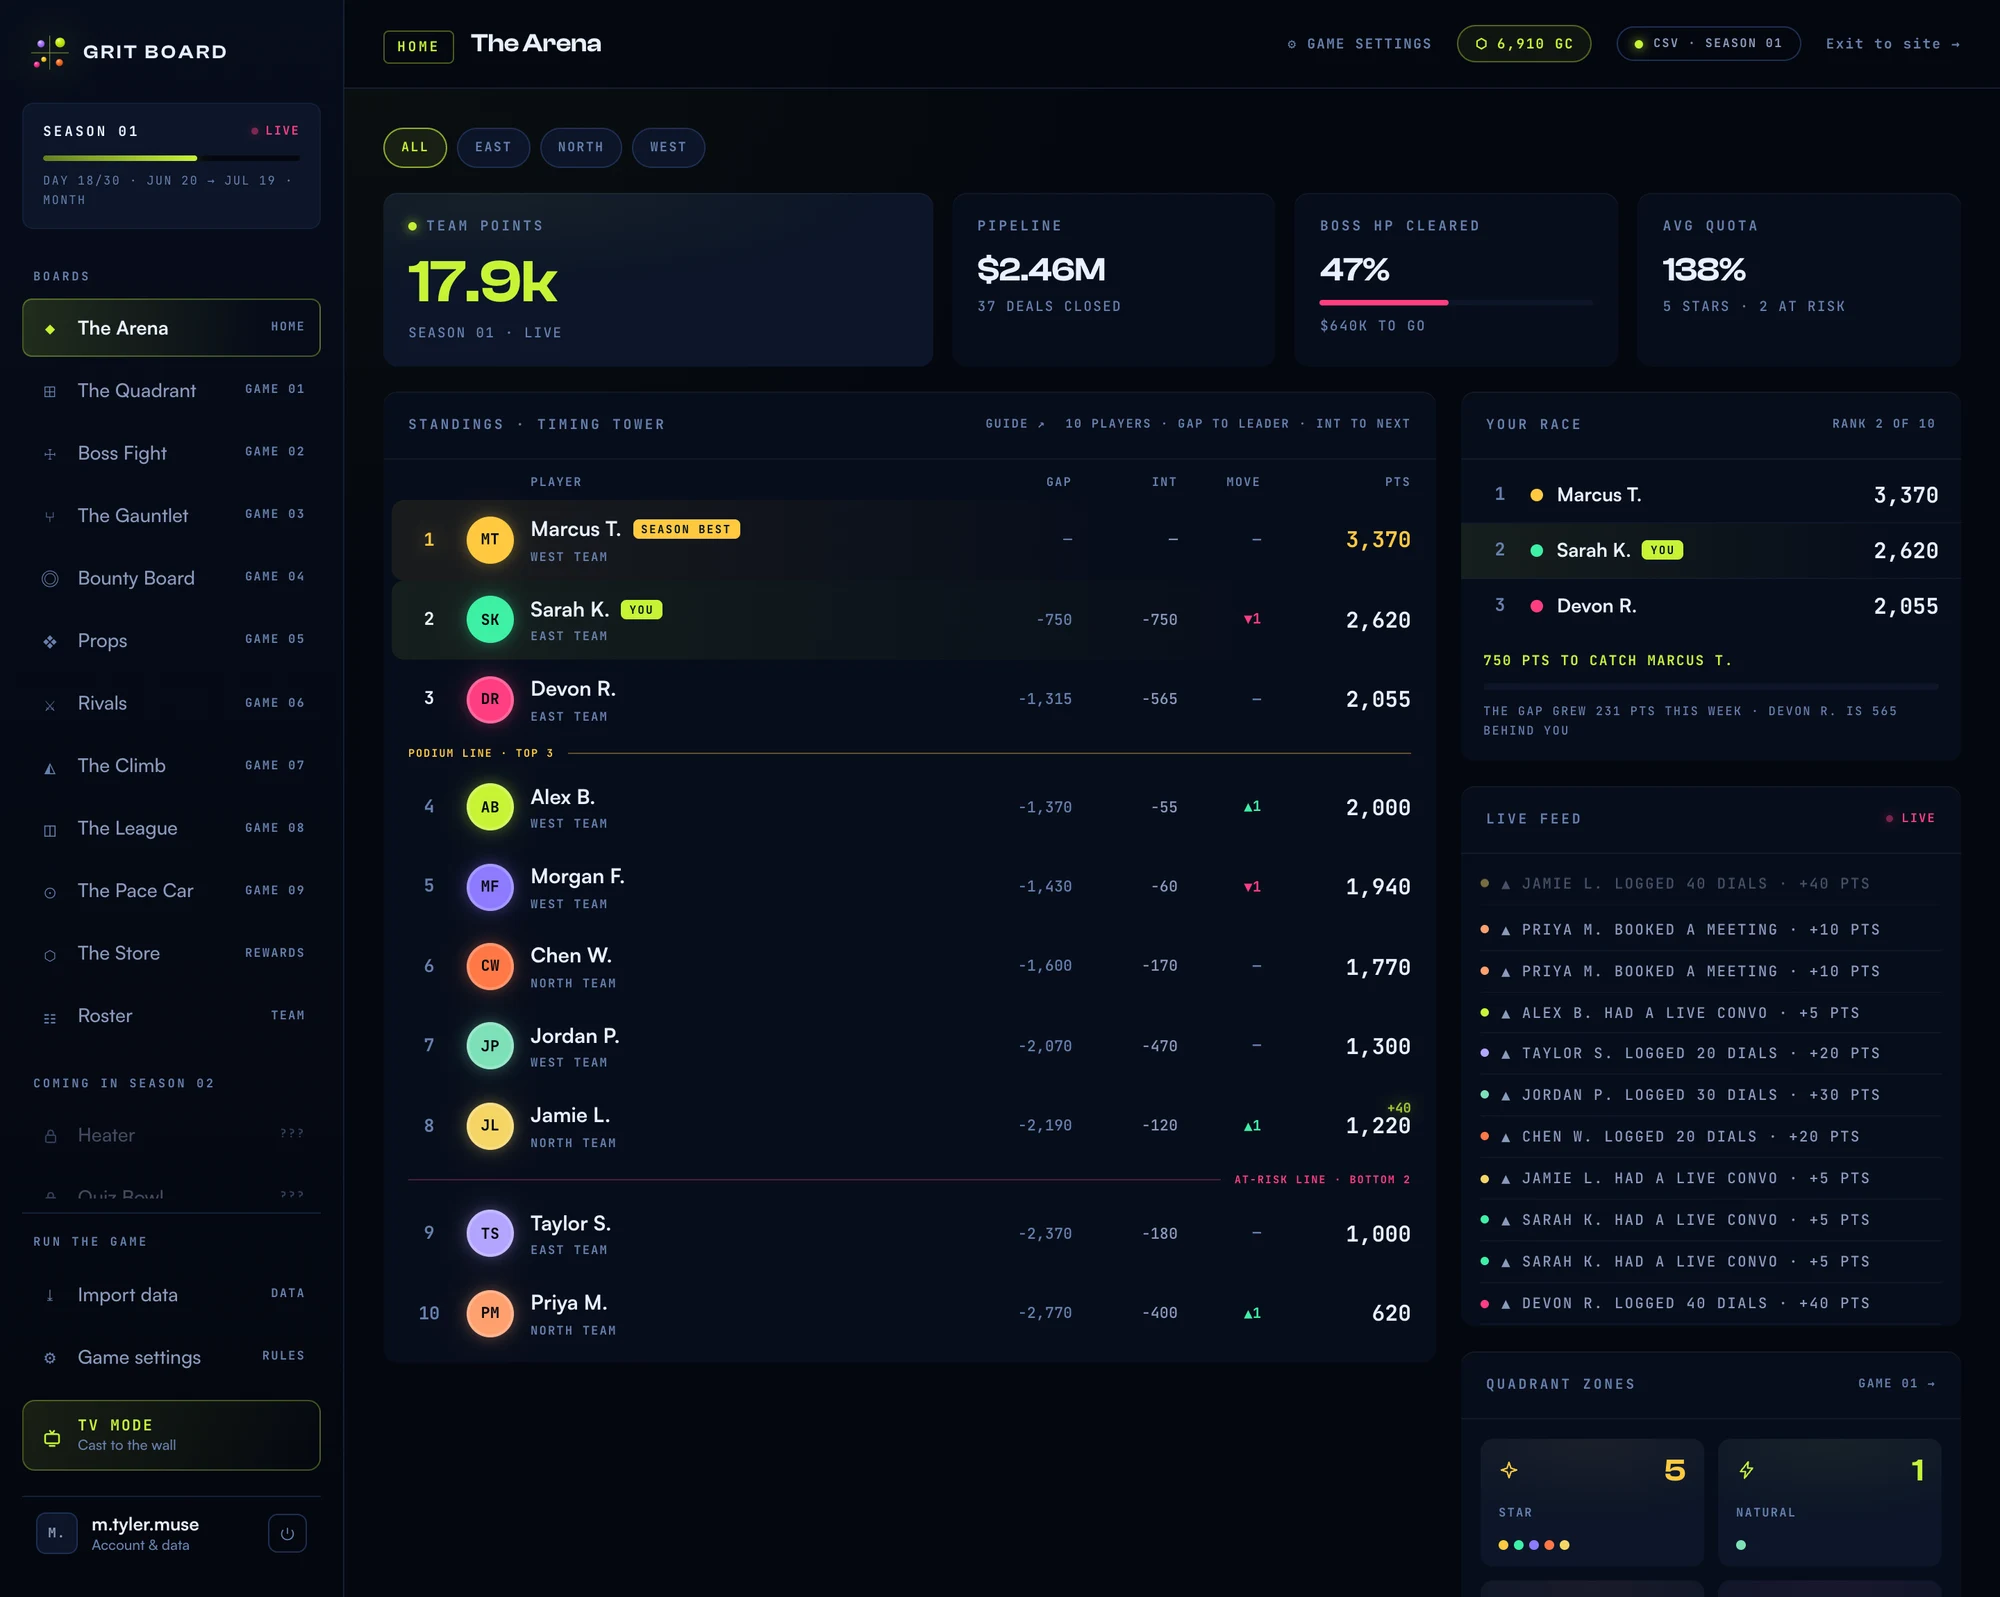
Top: the team’s four numbers. Left: the standings, raced like a timing tower. Right: your personal race, the live feed, and the Quadrant’s zone counts. The team chips up top filter almost everything by squad — the Boss Fight stays org-wide on purpose: one boss, shared fate.
02Since last sync: the reveal strip

Every import or CRM sync is a moment, not just a silent number change — this strip says what happened while you were away: what moved (+3 DEALS · +9 MEETINGS), how many points landed across the team, and who passed whom (▲ RYAN 4→2). It’s built only from real measured differences between two data captures — never invented. Three honest quiet states: a sync that changed nothing says NOTHING MOVED (a real measurement, not a gap); an org with no day-by-day history yet reads HISTORY STARTS AT YOUR NEXT SYNC instead of guessing at a recap it can’t back up; and a team that connects mid-season sees FIRST MEASUREMENT TAKEN · DAY 17 after its first sync — the season to date was measured once, and the reveal begins with the next one. See the Season report for how that history rolls up over a whole season.
03The four team numbers
Team points — the sum of everyone’s season points, ticking live. Pipeline — total pipeline dollars, with deals closed under it. Boss HP cleared — how much of the Boss Fight target the team has burned down, and what’s left. Avg quota — the team’s average attainment, with the count of Stars and At-Risk reps beside it. Four tiles, and a manager knows whether it’s a good week before scrolling.
04The timing tower
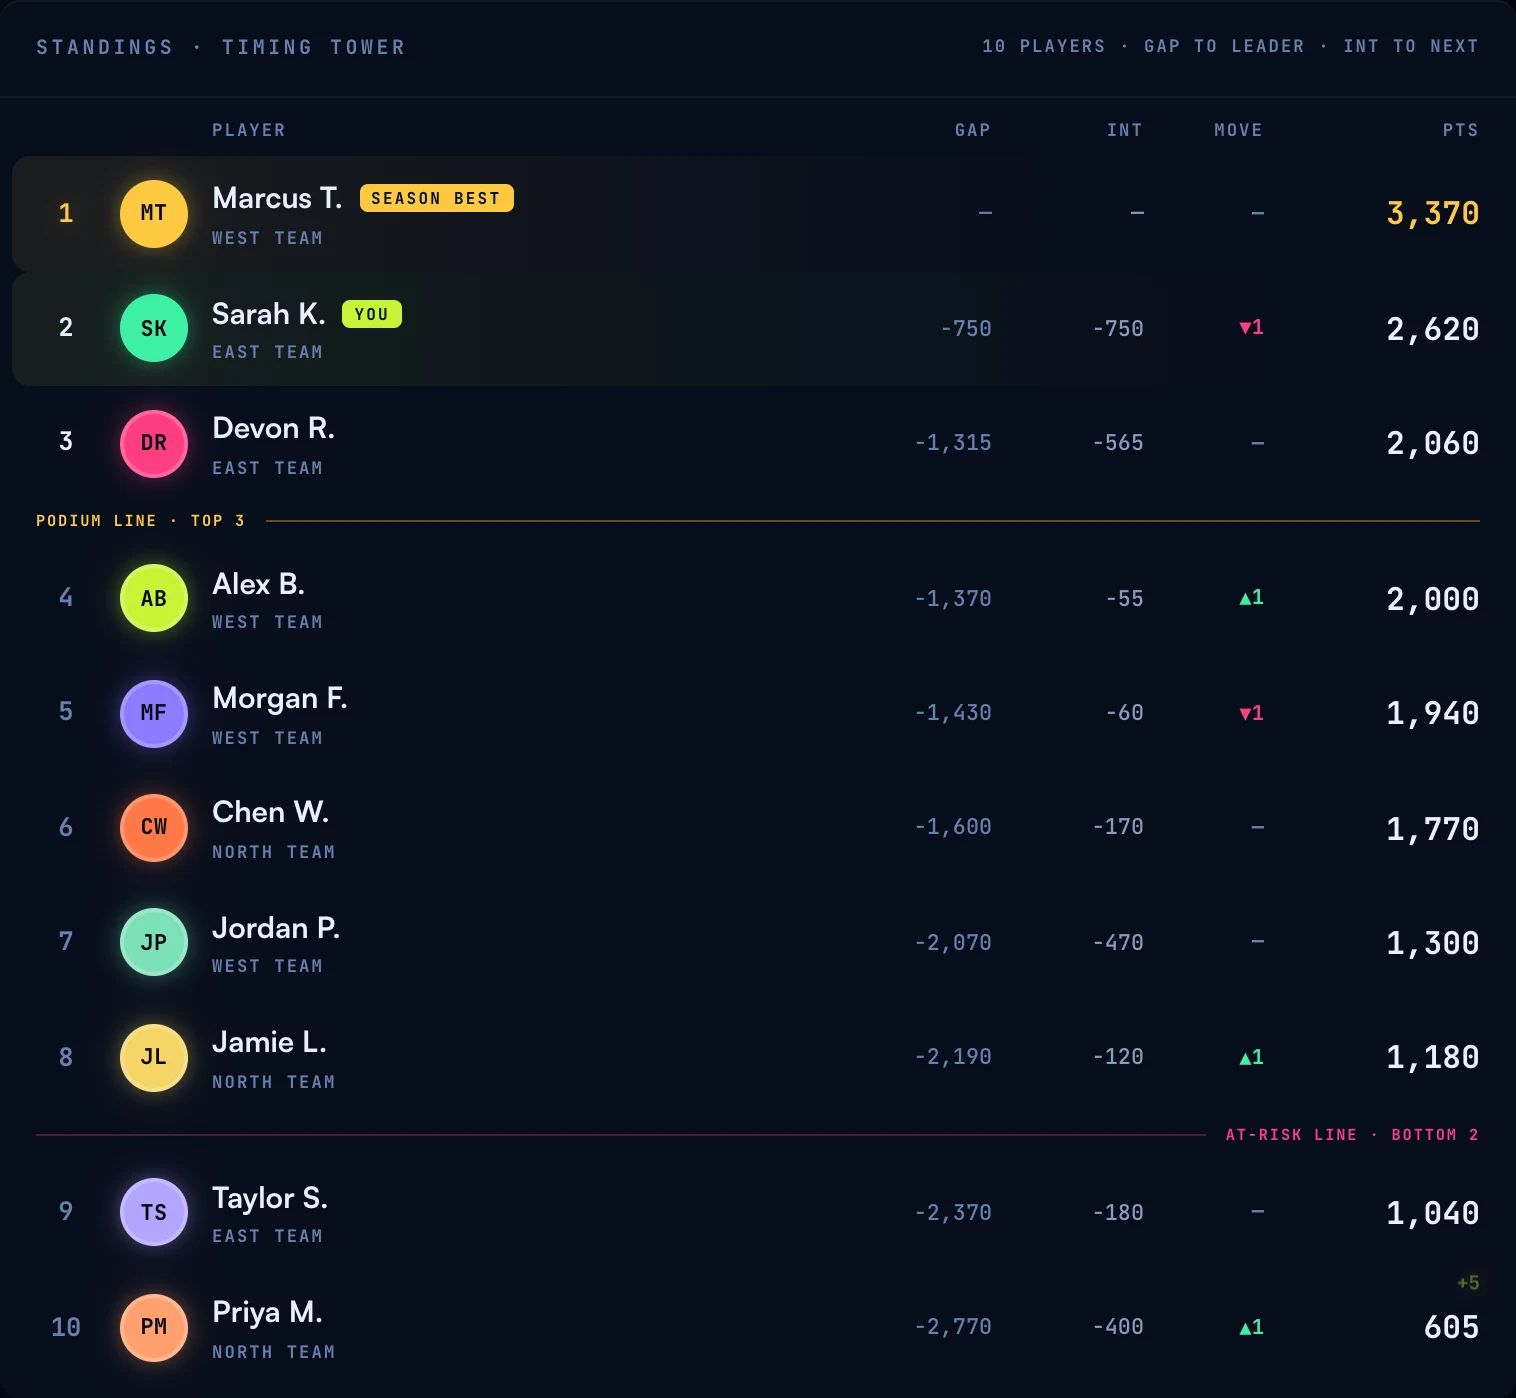
The standings borrow race-timing grammar, because a flat points list gives a rep in 7th place nothing to do with the information. Each row carries:
- GAP — points behind the leader. The long race: chase the crown.
- INT — points behind the rep directly ahead. The short race: beat the next name up. A 2,000-point gap is abstract; a 55-point interval is tomorrow’s work.
- MOVE — momentum: your recent stretch of the season measured against the stretch before it. ▲ means heating up, ▼ cooling off — it’s about trajectory, not rank changes, so a rep can hold 4th and still show ▲.
Chips mark form: SEASON BEST for the best trailing week anyone has put up this season, PERSONAL BEST when a rep tops their own. And the two cut lines — PODIUM LINE · TOP 3 and AT-RISK LINE · BOTTOM 2 — turn promotion and relegation pressure into geography you can see.
05Your Race
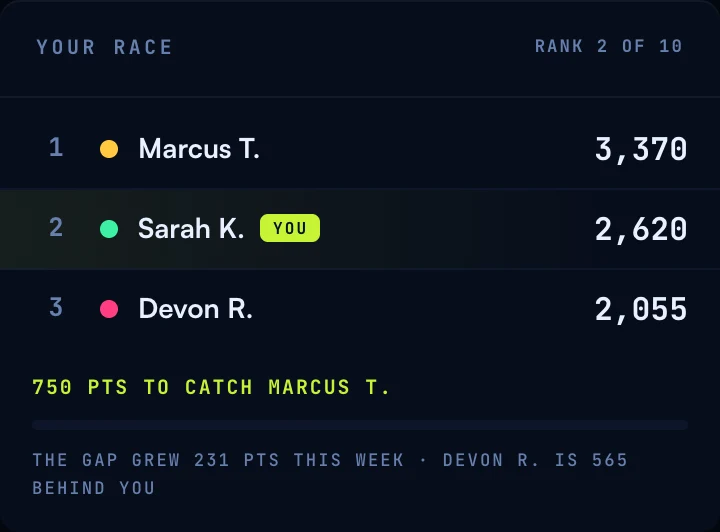
For a signed-in rep, this is the whole leaderboard reduced to the part that matters: the name ahead of you, the name behind you, the exact points to catch one and the cushion over the other — plus whether those gaps grew or shrank this week. Nobody should have to scan a table to know their fight.
06The feed, the zones, the spotlights
Live feed / Season Log — the ▲ ticker of activity, in your team’s own vocabulary. On demo data it’s a “Live feed” that animates to keep the room alive — ambiance, not an audit log, since the numbers underneath only change when new data lands. On a real org it’s labelled Season Log instead, tagged MEASURED once your org has day-by-day history and SEASON TOTALS until then — real dated lines (SEP 2 · RYAN KESSLER · +1 GROUP · +50 PTS) once captures exist, season-total summaries before that. The panel always says which kind of line you’re reading.
Quadrant zones — the team’s headcount in each of the four zones, one click from the full board. A manager’s fastest health check: watch the At-Risk count.
Game spotlights — live cards for the flagship games (the Quadrant, the Boss raid, the Gauntlet’s bracket state), each a doorway to its board.
07Common questions
“Is the feed real-time?” The board updates whenever new data lands — a CSV import or CRM sync. Between updates the feed replays recent activity so the screen breathes, but nothing scores until the data actually arrives.
“My rank didn’t change but MOVE shows ▼.” MOVE is momentum, not rank: it compares your recent pace to your prior pace. Holding your rank while slowing down is exactly what it’s built to catch.
“Can I put this on the office TV?” That’s what TV mode is — TV MODE in the sidebar opens a full-bleed rotation built for a wall screen. Any browser, no hardware.
More questions? Write to hello@gritboard.io — a human reads it.